

Unlocking the Power of Visualization: The Ultimate Comprehensive Guide to Understanding and Creating Accurate Graph Equations in Mathematics

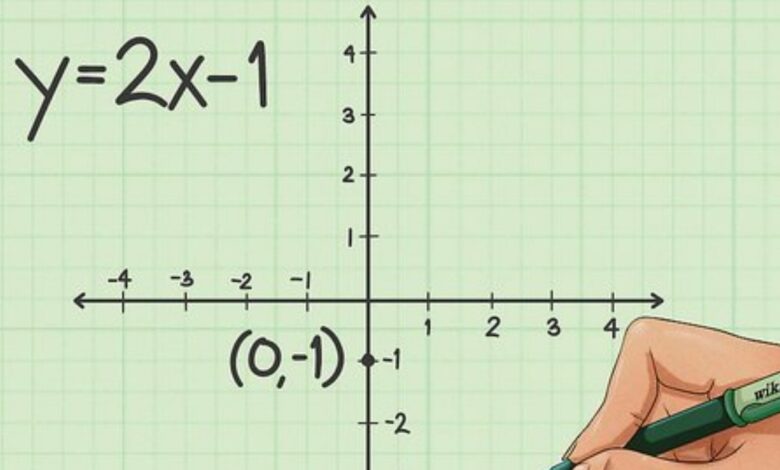
The ability to graph equations is one of the most transformative skills in mathematics, acting as a bridge between abstract algebraic expressions and tangible visual representation. By transforming a string of variables and constants into a coherent shape on a coordinate plane, students and professionals alike can unlock deep insights into how functions behave, intersect, and change over time. Whether you are analyzing a simple linear path or a complex conic section, mastering the techniques required to plot these relationships allows you to communicate data effectively, solve for unknowns with greater clarity, and develop a stronger intuitive grasp of algebraic systems.
| Feature | Details |
| Primary Goal | How to successfully graph equations |
| Core Tools | Cartesian Coordinate Plane (x and y axes) |
| Common Forms | Slope-intercept, standard, and vertex |
| Visual Benefits | Identifying intercepts, slope, and symmetry |
| Advanced Tools | Graphing calculators and software |
The Foundations of the Cartesian Plane
To successfully graph equations, you must first master the Cartesian coordinate plane. This system consists of two perpendicular lines: the horizontal x-axis and the vertical y-axis. The point where they intersect, (0,0), is known as the origin. Every point in a two-dimensional space is defined by an ordered pair (x,y), where x represents the horizontal displacement and y represents the vertical displacement. Understanding this grid is the mandatory first step for plotting any mathematical relationship, as it provides the universal language required to turn numerical data into visual geometry that is easy for anyone to interpret.
Plotting Linear Equations in Slope-Intercept Form
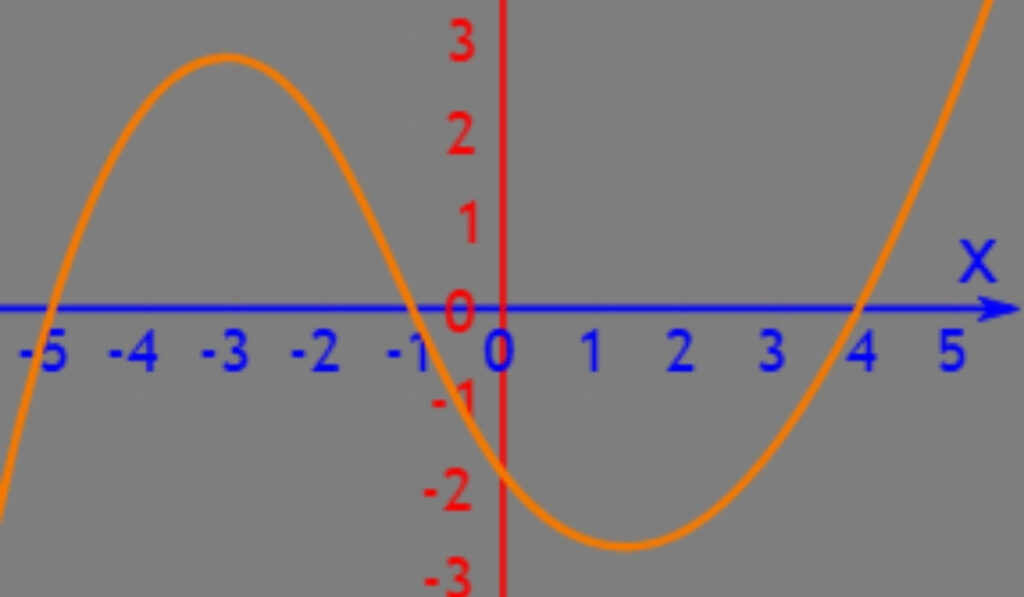
The most common task when you start to graph equations is handling linear functions in slope-intercept form, expressed as y=mx+b. In this formula, m represents the slope (the rise over run), and b represents the y-intercept (where the line crosses the vertical axis). To plot this, start by marking the y-intercept at (0,b) on the grid. From that point, use the slope to find a second point by moving vertically and horizontally according to the ratio of m. Connect these points with a straight line, and you have visualized your linear equation perfectly.
Understanding the Standard Form
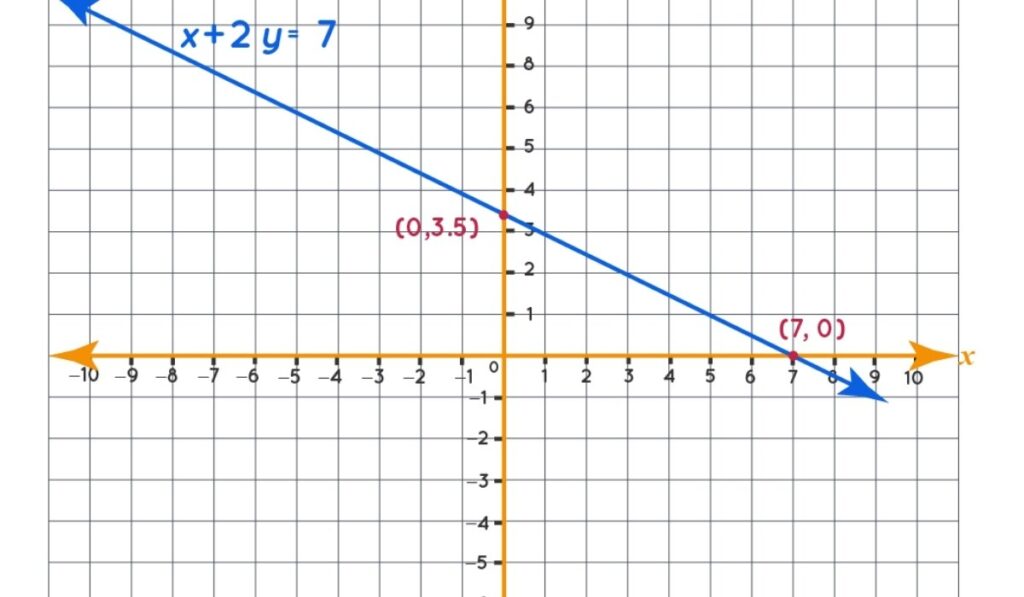
Sometimes, teachers ask students to graph equations that are written in the standard form, Ax+By=C. This format is often harder to plot directly than the slope-intercept form, so the best strategy is to find the x and y intercepts. To find the y-intercept, set x=0 and solve for y. Conversely, to find the x-intercept, set y=0 and solve for x. Once you have these two points, you can simply draw a line between them. This approach is highly efficient for linear systems and avoids the need to rearrange the entire expression.
Visualizing Quadratic Functions and Parabolas
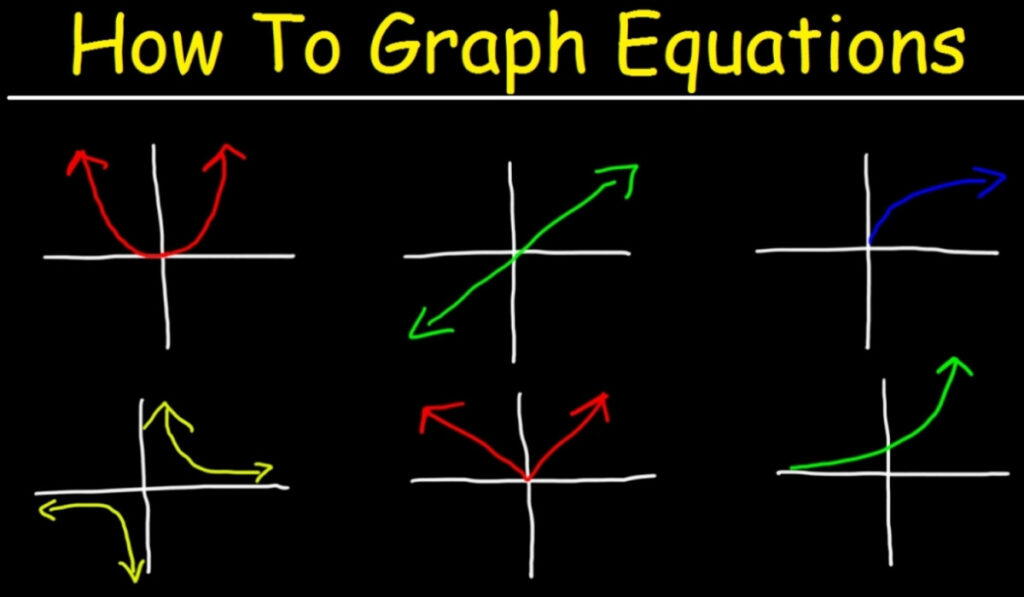
When you move to quadratic functions, which follow the form y=ax2+bx+c, you are no longer plotting straight lines; you are creating parabolas. To graph equations of this type, identify the vertex first, which represents the highest or lowest point of the curve. The x-coordinate of the vertex is found using the formula x=−b/(2a). Once you find this, substitute it back into the original equation to solve for the y-coordinate. After plotting the vertex, pick a few surrounding x-values to find additional points, which will help you draw the characteristic U-shape of the curve.
The Role of Symmetry in Quadratic Graphs
Symmetry is a critical concept when you graph equations that are quadratic. Every parabola has an axis of symmetry, which is a vertical line passing through the vertex that divides the curve into two mirror images. If you identify one point on the curve, you can use the axis of symmetry to reflect it to the other side. This property significantly speeds up the plotting process. Recognizing this symmetry is not only a time-saver but also helps you ensure that your graph is accurate, as both sides of your parabola should look identical in shape and curvature.
Graphing Absolute Value Functions
Absolute value functions, written as y=a∣x−h∣+k, produce a distinct V-shape on a graph. When you graph equations featuring an absolute value, the vertex is located at the point (h,k). The variable a determines whether the V opens upwards or downwards and how steep the sides are. Similar to parabolas, you should plot the vertex first and then identify a few points on either side of it. Because the absolute value function is essentially two linear rays meeting at a point, once you find a few key points, drawing the shape becomes very intuitive.
Working with Exponential Growth and Decay
Exponential functions, which appear as y=a⋅bx, represent rapid growth or decay. When you graph equations of this nature, you will notice that the curve never actually touches the x-axis, creating what mathematicians call an asymptote. As x increases, the y-value either explodes toward infinity or approaches zero. To plot these, start by creating a table of values for small x integers. Exponential curves move very quickly, so having precise points is necessary to capture the sharp curvature that defines these unique functions, which appear frequently in finance, biology, and population studies.
Plotting Rational Functions and Asymptotes
Rational functions, defined as the ratio of two polynomials, are among the most interesting to visualize. When you graph equations that include denominators containing variables, you must look for points where the function is undefined, which usually leads to vertical asymptotes. These are invisible lines that the graph will approach but never touch. Additionally, consider the end behavior of the graph to find horizontal asymptotes. Rational functions often result in curves with multiple branches, making them a great challenge for students looking to develop a deeper understanding of how complex mathematical relationships function and behave across the coordinate plane.
Graphing Circles Using the Standard Form
Circles are defined by the equation (x−h)2+(y−k)2=r2. To graph equations of a circle, identify the center (h,k) and the radius r, which is the square root of the constant on the right side. Start by plotting the center point. Then, move r units up, down, left, and right from that center to mark the edges of the circle. Connect these four points with a smooth, rounded shape. Circles are unique because they are not functions (they fail the vertical line test), yet they are essential components of geometry and trigonometry coursework.
The Importance of Scale and Proportion
When you graph equations, always ensure your scale is consistent. Using different units for the x and y axes can distort the appearance of your function, leading to incorrect interpretations. If you are plotting a slope of 1, it should look like a 45-degree angle. If your axes are scaled unevenly, your line will appear flatter or steeper than it truly is. Maintaining a consistent, well-labeled scale is a fundamental habit that ensures your visual representations remain faithful to the original mathematical expression, allowing you to trust the data you are observing on your page or screen.
Utilizing Technology for Precision
While manual plotting is essential for learning, modern students often use software when they need to graph equations for advanced work. Tools like Desmos, GeoGebra, and graphing calculators can plot complex functions in milliseconds. These tools allow you to experiment by changing variables in real-time, helping you see how shifting a constant or altering a coefficient changes the shape of the graph. While technology is a powerful aid, ensure you understand the underlying principles first. Technology should be a tool to verify your work and explore advanced concepts, not a shortcut that replaces your foundational algebraic knowledge.
Dealing with Intersecting Graphs
A common scenario is being asked to graph equations to find where they intersect. This is done by plotting both lines on the same set of axes and identifying the coordinate (x,y) where they cross. This visual solution method is an excellent way to solve systems of linear equations. If the lines are parallel, they will never intersect, meaning there is no solution. If they are the same line, there are infinite solutions. This graphical method provides a brilliant visual confirmation for algebraic solutions, helping you “see” the relationship between two distinct mathematical rules simultaneously.
Identifying Key Features: Intercepts and Maxima
Once you graph equations, always label your key features. Identifying the x and y intercepts is essential, as these often hold specific meaning in real-world problems. Furthermore, for non-linear functions, identifying the maximum or minimum points is crucial. These features tell the story of the function. For example, in a physics problem, a maximum point might represent the peak height of a thrown ball. By labeling these features, you transform a simple line into a meaningful piece of data that can be used to make predictions, explain phenomena, and solve real-world problems effectively.
Graphing Inequalities and Shading
Inequalities add a new dimension to graphing. When you graph equations that use signs like < or >, you aren’t just drawing a line; you are defining a region. Use a dashed line for inequalities that are “less than” or “greater than,” and a solid line for those that include “or equal to.” Then, shade the side of the line that satisfies the inequality. This shading represents the set of all possible solutions. Learning to correctly shade the plane is a fundamental skill for linear programming and optimization, allowing you to solve complex problems with multiple constraints.
The Role of Coefficients in Shaping Graphs
The coefficients in your equations dictate the “personality” of your graph. When you graph equations, you will see that the leading coefficient determines the steepness of a line or the width of a parabola. For instance, a larger coefficient in a quadratic function makes the parabola appear narrower. Recognizing how these small numbers change the visual output is key to developing mathematical intuition. By observing these patterns, you can often “predict” what an equation will look like before you even pick up a pencil to draw, which is a sign of true mastery over the subject.
Preparing for Advanced Trigonometric Graphs
Trigonometric functions like y=sin(x) and y=cos(x) introduce the concept of periodicity. When you graph equations involving these functions, you are plotting wave patterns that repeat indefinitely. These graphs are defined by amplitude, period, and phase shift. Because these waves are continuous, you usually plot one or two full cycles to represent the entire function. These graphs are vital for understanding phenomena like sound waves, light, and electricity. Once you master the basic waves, you can apply transformations to stretch, compress, or shift them to represent a nearly infinite variety of periodic data.
Tips for Drawing Smooth Curves
Drawing smooth curves is a practical challenge when you graph equations like parabolas or circles by hand. Instead of drawing one quick line, use a series of light, connected marks to guide your pen. Ensure your curve is rounded at the vertex rather than coming to a sharp point. Practice makes perfect here. If you are struggling, plot more points to guide your hand. A smooth curve not only looks better but also accurately represents the nature of continuous functions. Accurate drawings are essential for identifying intersections and other features, so take the time to draw with care and precision.
Graphing Piecewise Functions
Piecewise functions are defined by different rules for different intervals of x. When you graph equations of this type, you must plot each part on its own restricted domain. You might have a line for x<0 and a parabola for x≥0. These graphs often result in jumps or “discontinuities” where the pieces don’t meet. Handling these requires careful attention to the endpoints—use an open circle for “less than” and a closed circle for “or equal to.” These functions are excellent for modeling real-world situations, such as tax brackets or tiered pricing models.
Evaluating Graphing Success
After you finish your work to graph equations, perform a quick check. Does the graph make sense given the equation? For example, if your equation is y=−x2, does your parabola open downwards? If your linear equation has a positive slope, is the line rising from left to right? Simple verification steps take only a few seconds but prevent common mistakes. If you find a discrepancy, re-check your points or your slope calculation. Success in graphing is all about the details, and double-checking your work is the best way to ensure your mathematical conclusions are accurate and sound.
Final Reflections on Mathematical Visualization
Mastering the ability to graph equations is a milestone in your mathematical journey. It changes the way you look at the world, turning abstract numbers into a visual map of behavior and change. Whether you are using these skills for school, professional engineering, or simply to satisfy your curiosity, the ability to visualize algebraic relationships is a powerful asset. Keep practicing, explore different types of functions, and never hesitate to use the coordinate plane to explore the “why” behind the “what.” Mathematics is not just about solving for x; it is about understanding the beautiful, infinite shapes that equations create.
- Why do we graph equations?
- Graphing helps us visualize relationships, solve for unknowns, and understand the behavior of functions in a two-dimensional space.
- How do I know if my parabola should open up or down?
- Look at the leading coefficient; if it is positive, the parabola opens up, and if it is negative, it opens down.
- What is the easiest way to graph a linear equation?
- The slope-intercept form (y=mx+b) is generally the fastest method, as it gives you a starting point and a direction.
- How do I solve a system of equations by graphing?
- Plot both lines on the same coordinate plane; the point where they cross is the solution to the system.
- Can I use a graphing calculator for all my work?
- While calculators are great for verification, it is important to understand the manual steps to ensure you truly grasp the mathematical concepts.